Crisis Navigation & Financial Recovery
0 → 1 • Process Visualization
Helping auto loan customers manage the financial and logistical stress of a totalled vehicle.
Highlights
Aug 2022 – Feb 2023
15% increase in payer rate
Lead Product Designer, Researcher & UX Writer
Capital One
Executive Summary
Developed the first-ever digital experience for customers navigating the "total loss" of a vehicle. This project transformed a traumatic and opaque financial process into a guided, transparent journey that significantly reduced call volume and improved loan repayment rates.
The Problem
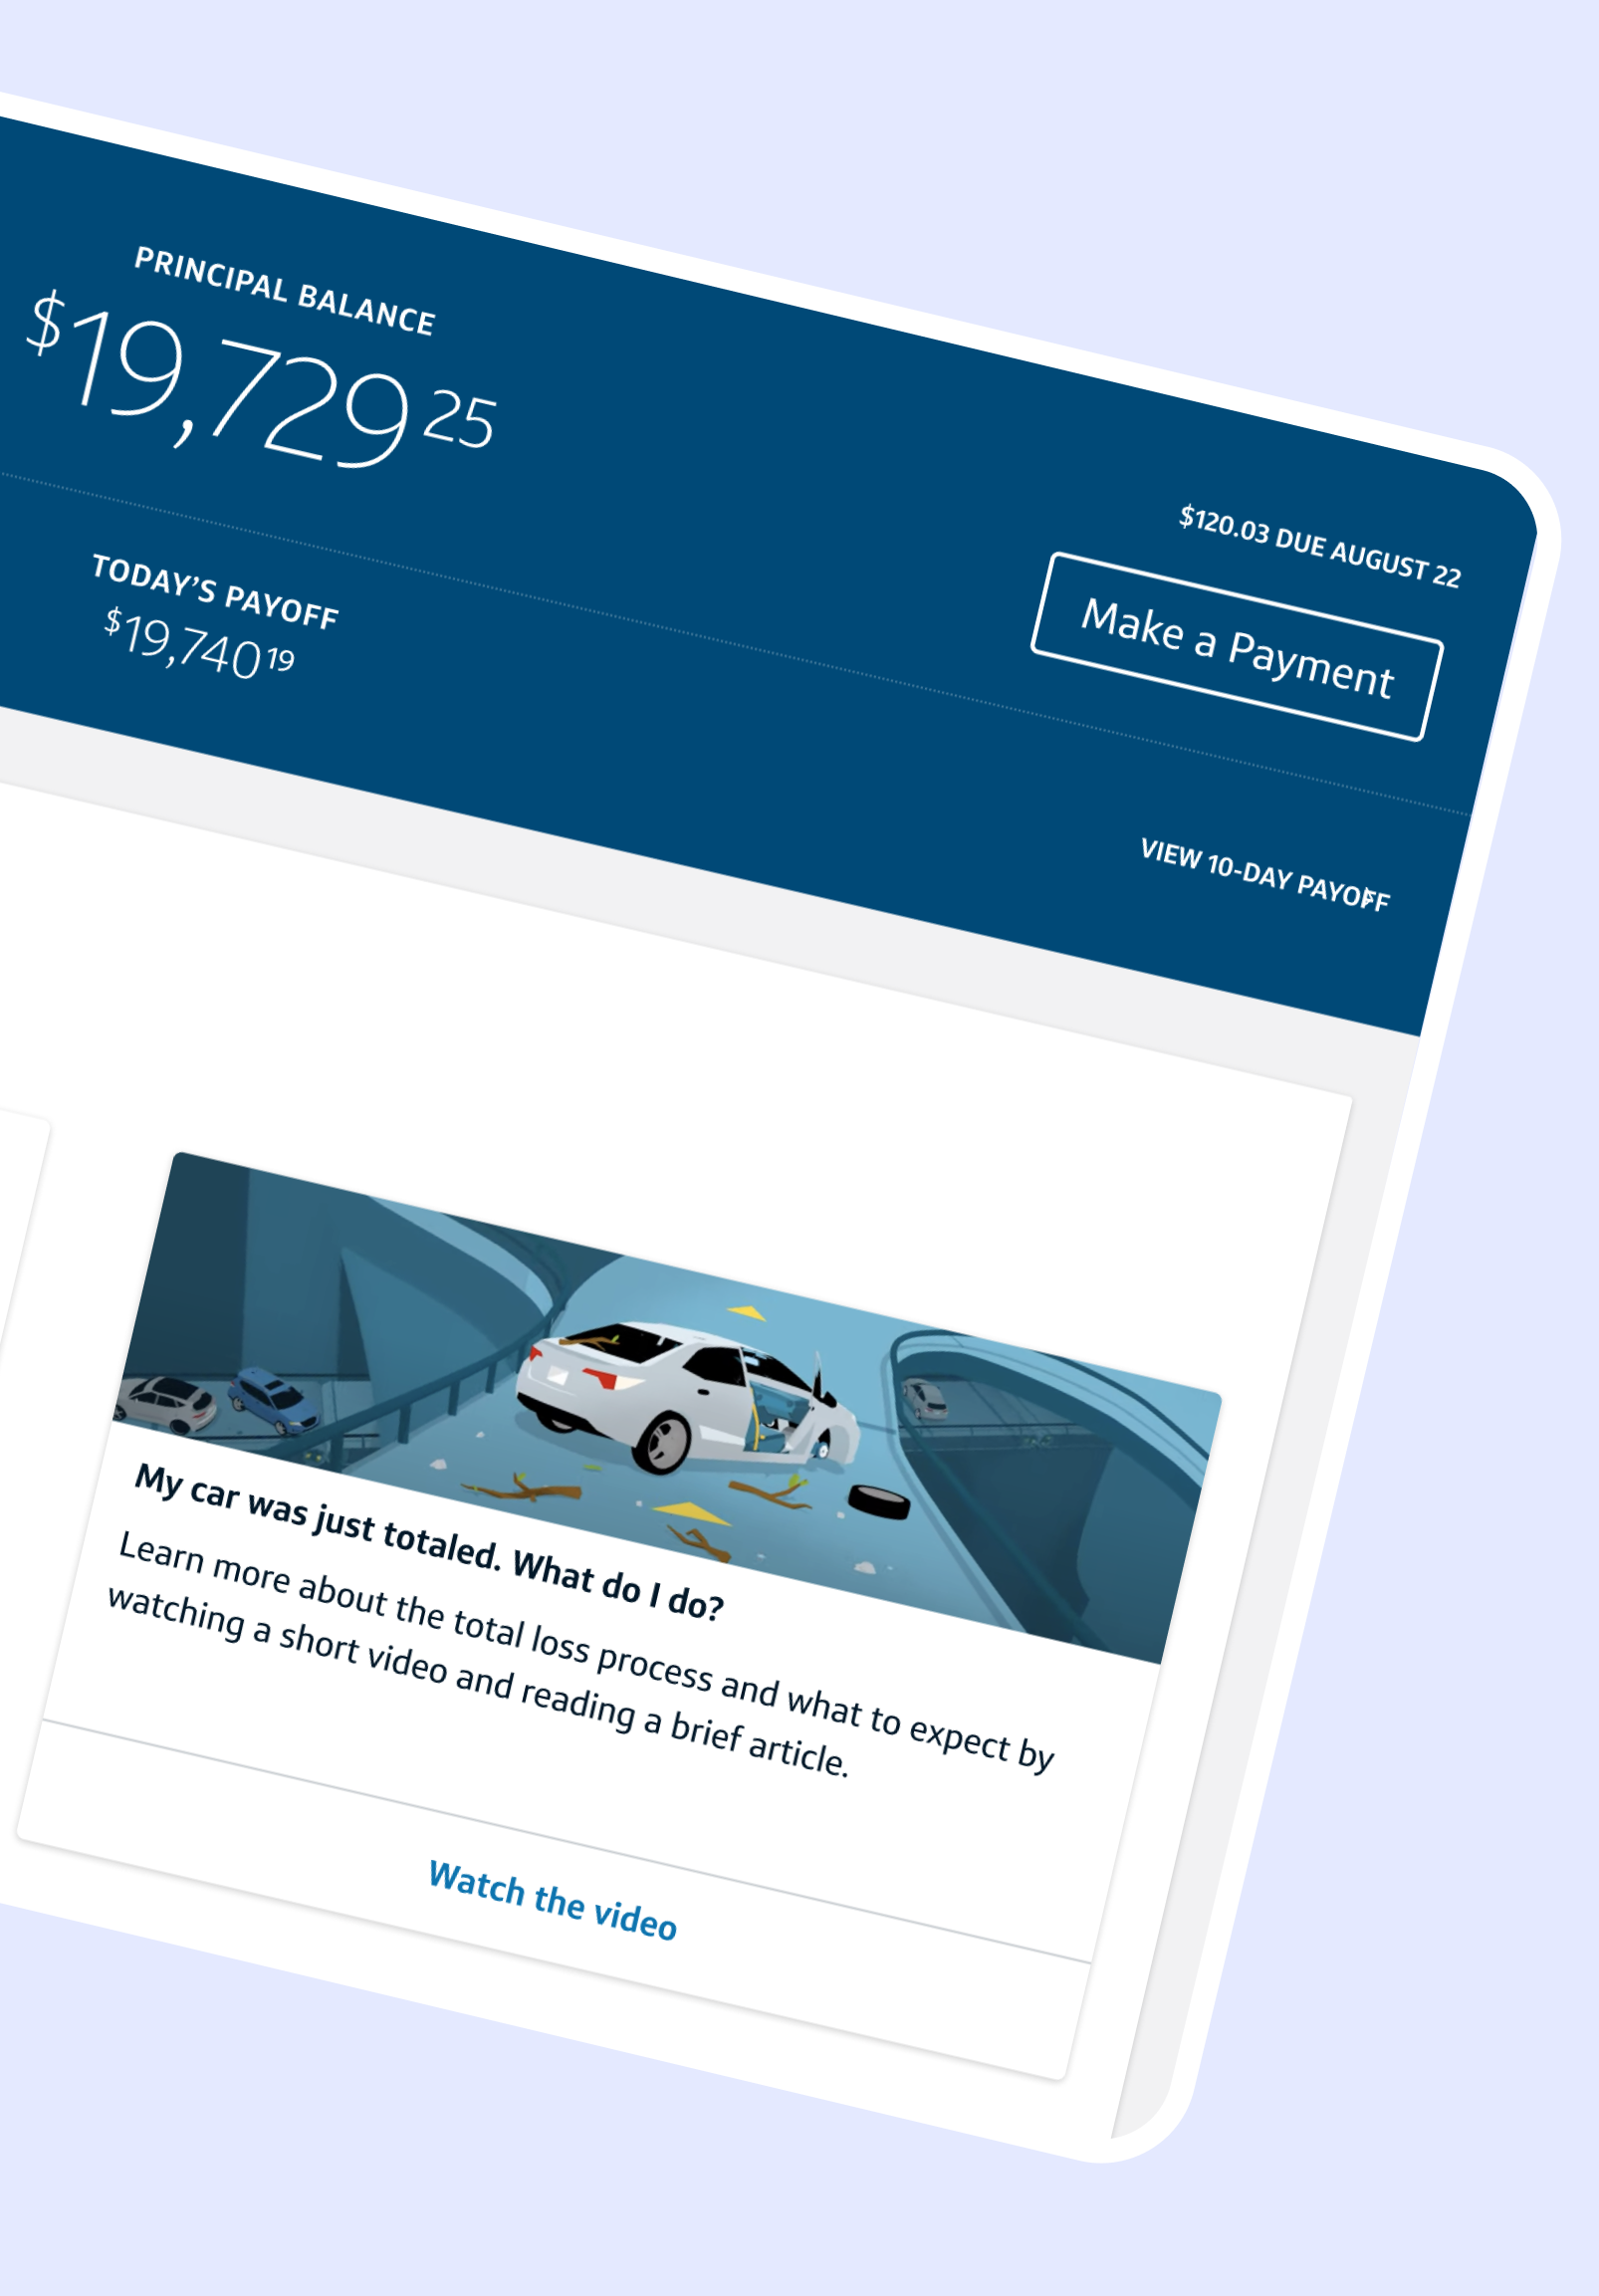
When a vehicle is totaled, customers enter a "black hole" of information. Without a digital dashboard, they were unsure how to deal with insurance, what documents were needed, or if they should continue making loan payments during the resolution period.
My Approach
I co-led a two-day discovery workshop with product, tech, and process partners to map the complex total loss timeline:
Scenario Mapping: We defined nine distinct customer narratives based on variables like insurance settlements, GAP insurance, and warranties.
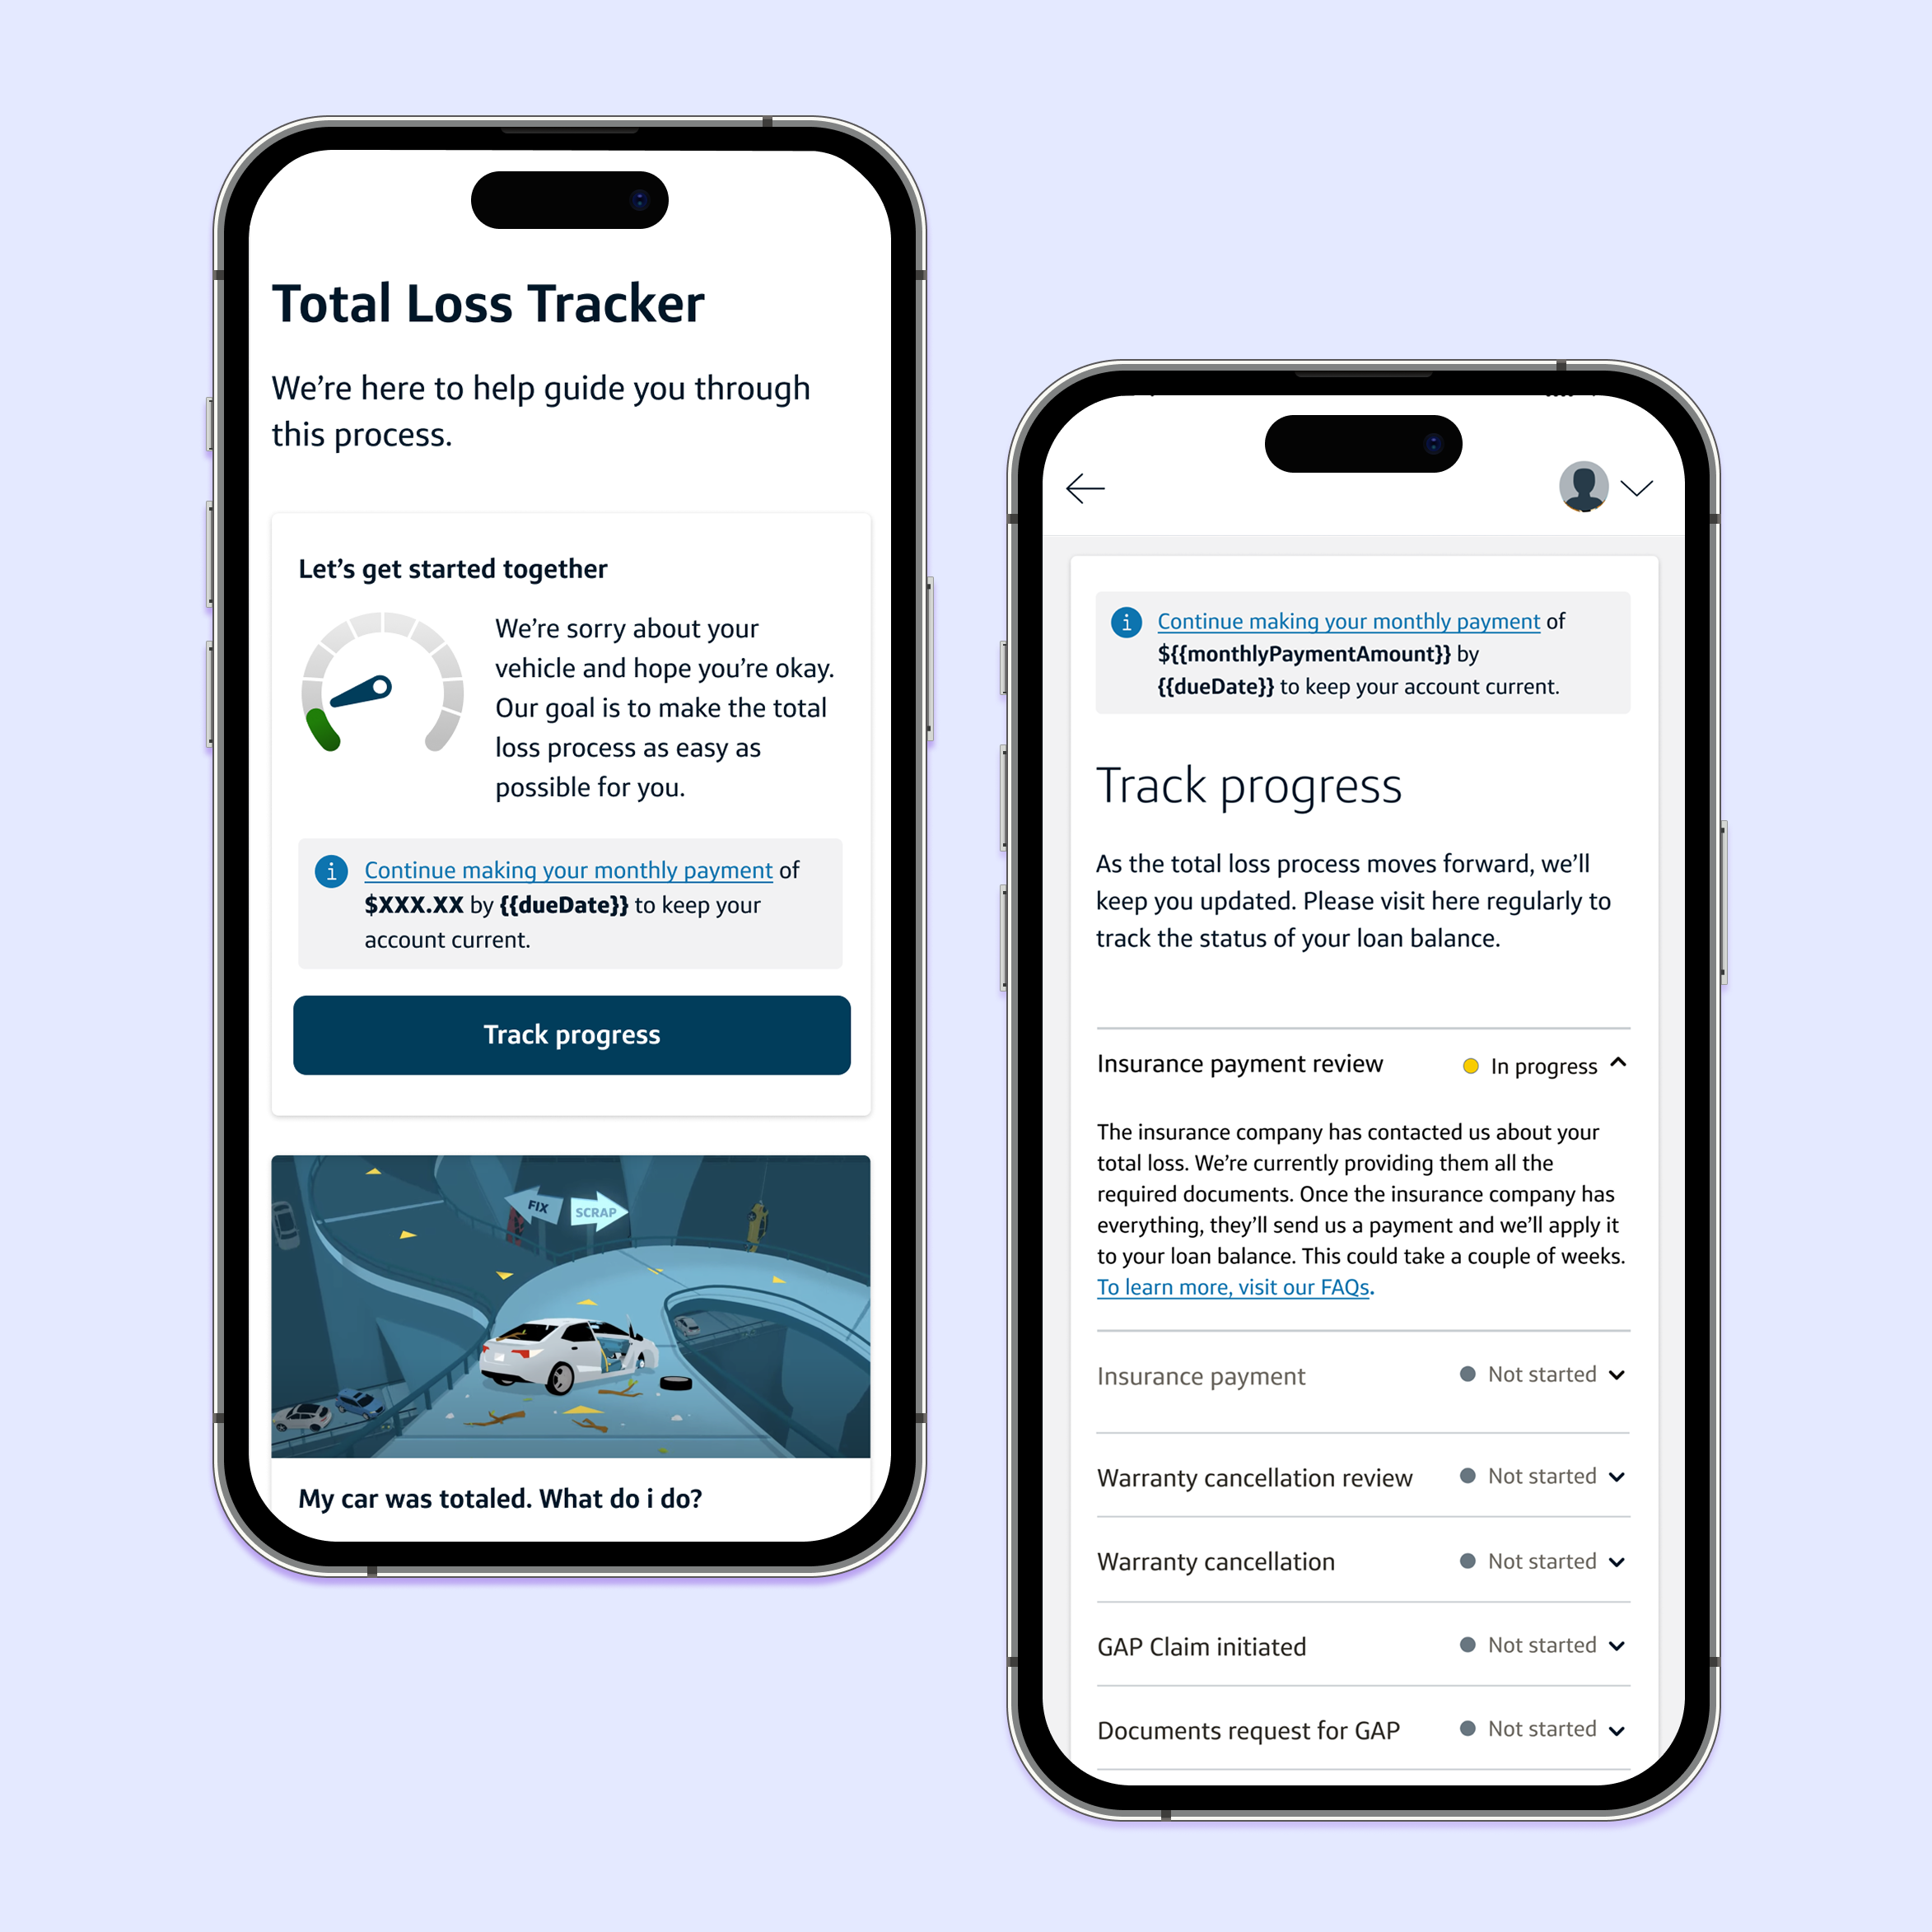
User Flow: I translated these complex scenarios into a simplified user flow focused on a personalized "Total Loss Dashboard".
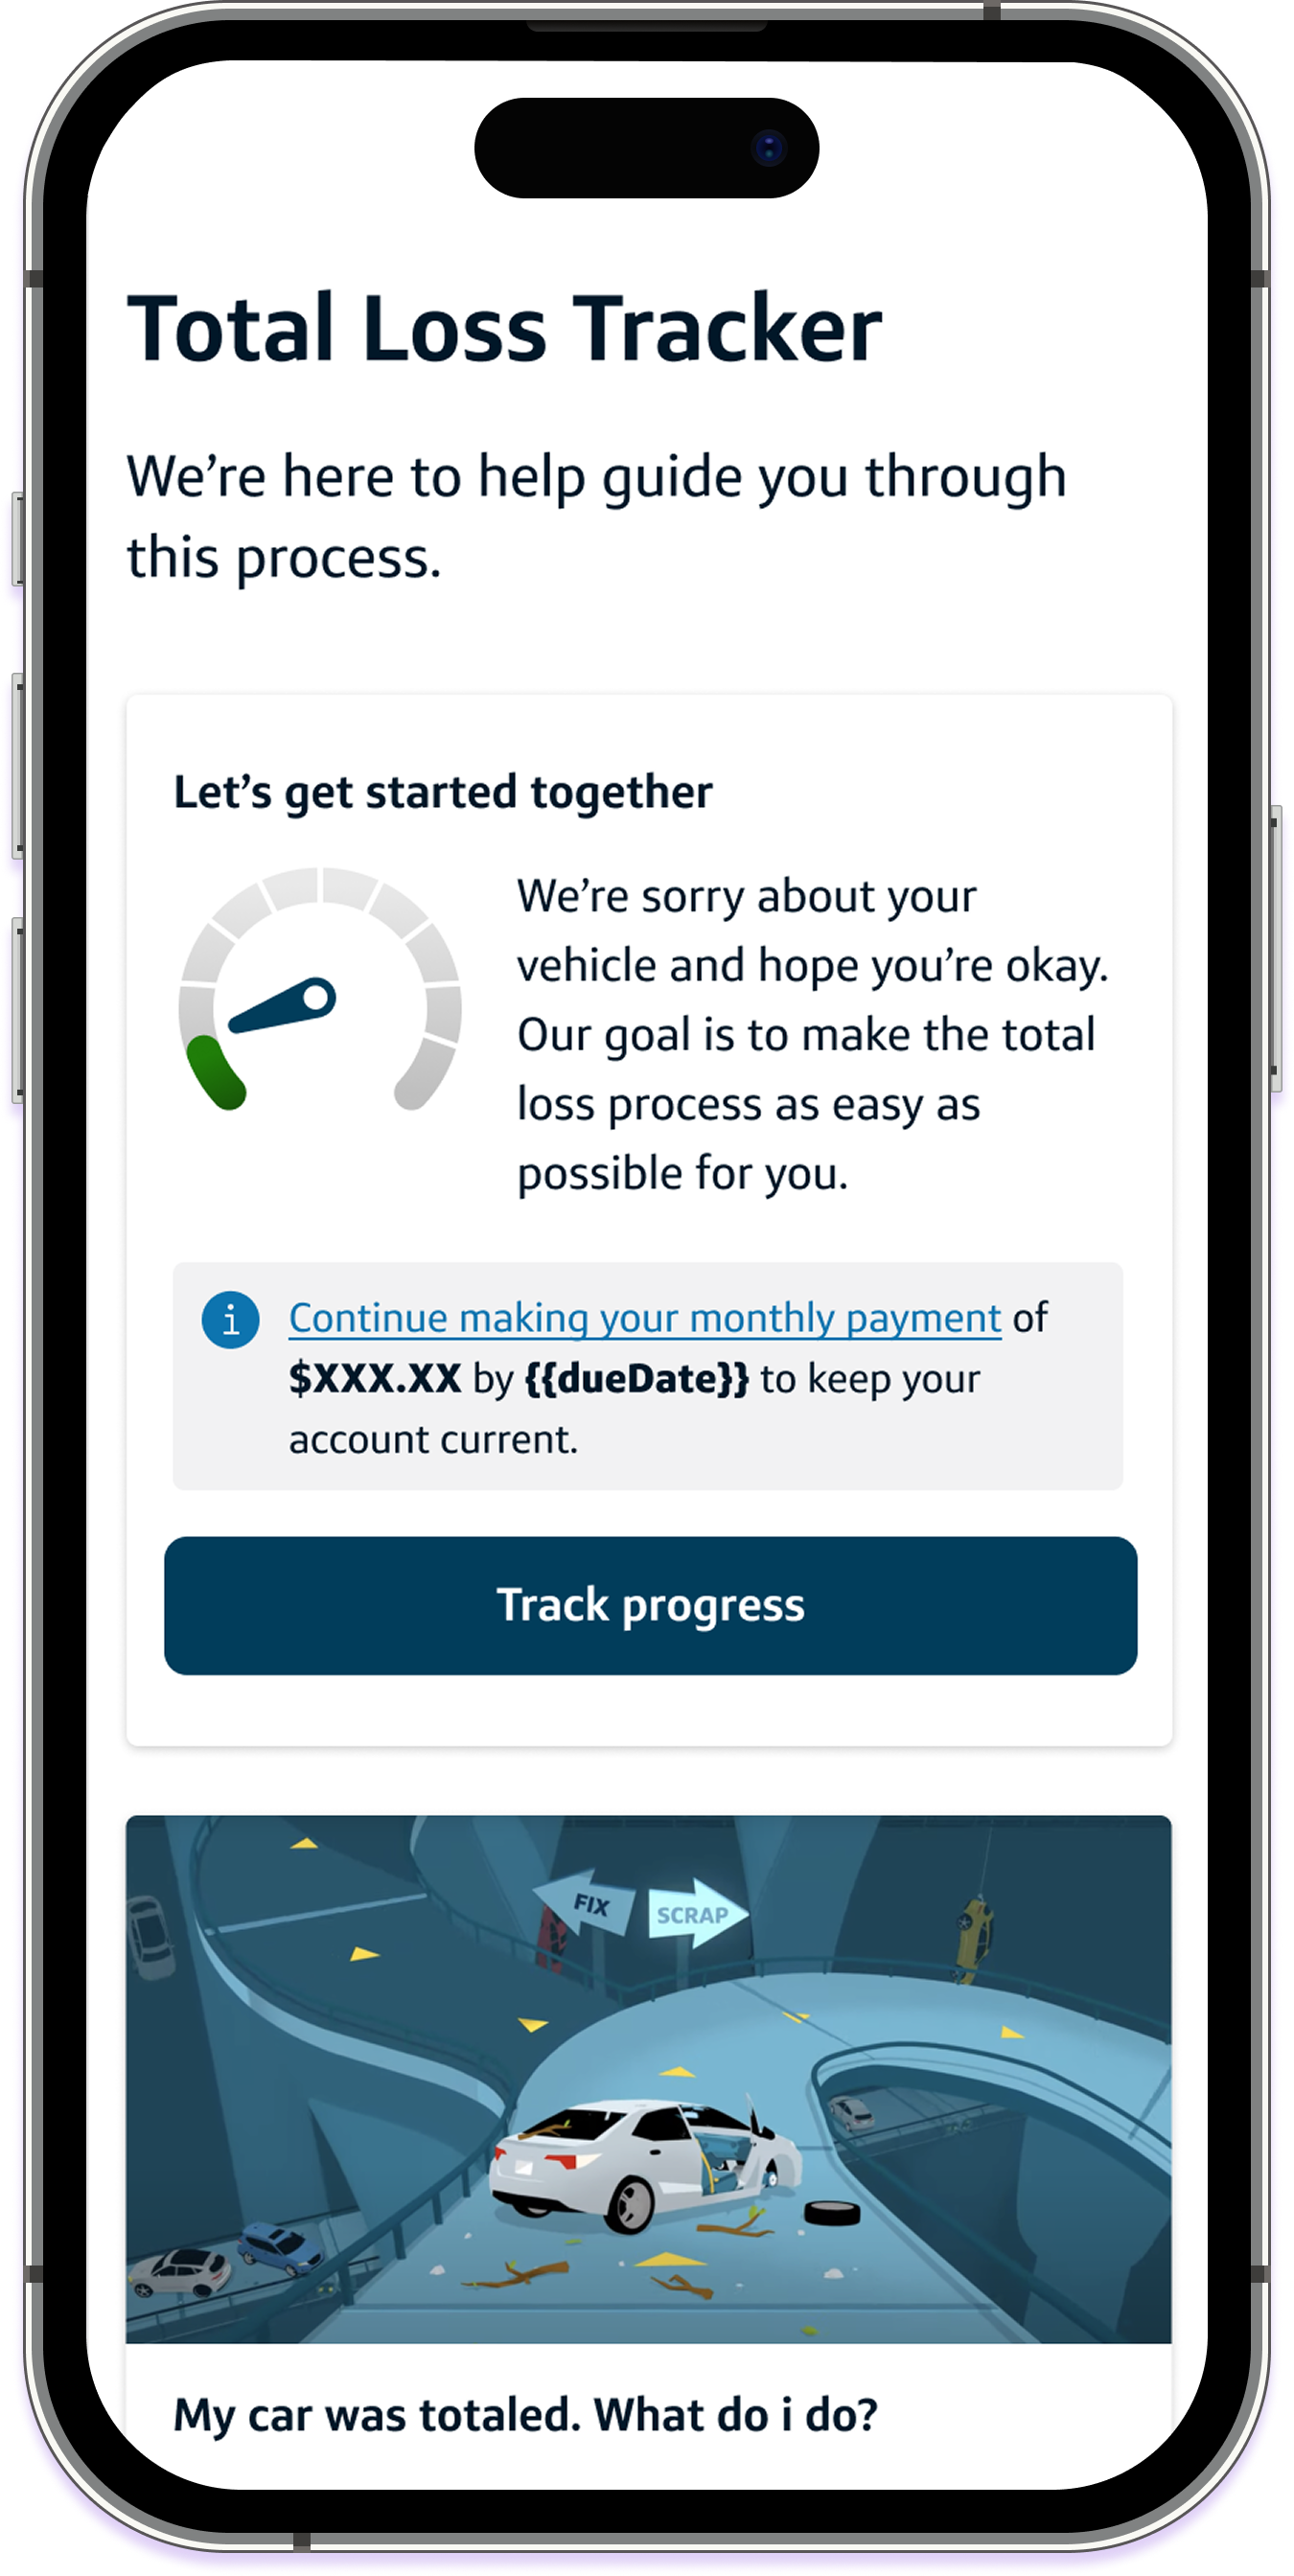
User Goal: The primary objective was to provide peace of mind by showing the exact "What's Next" for loan payoff.
The Solution
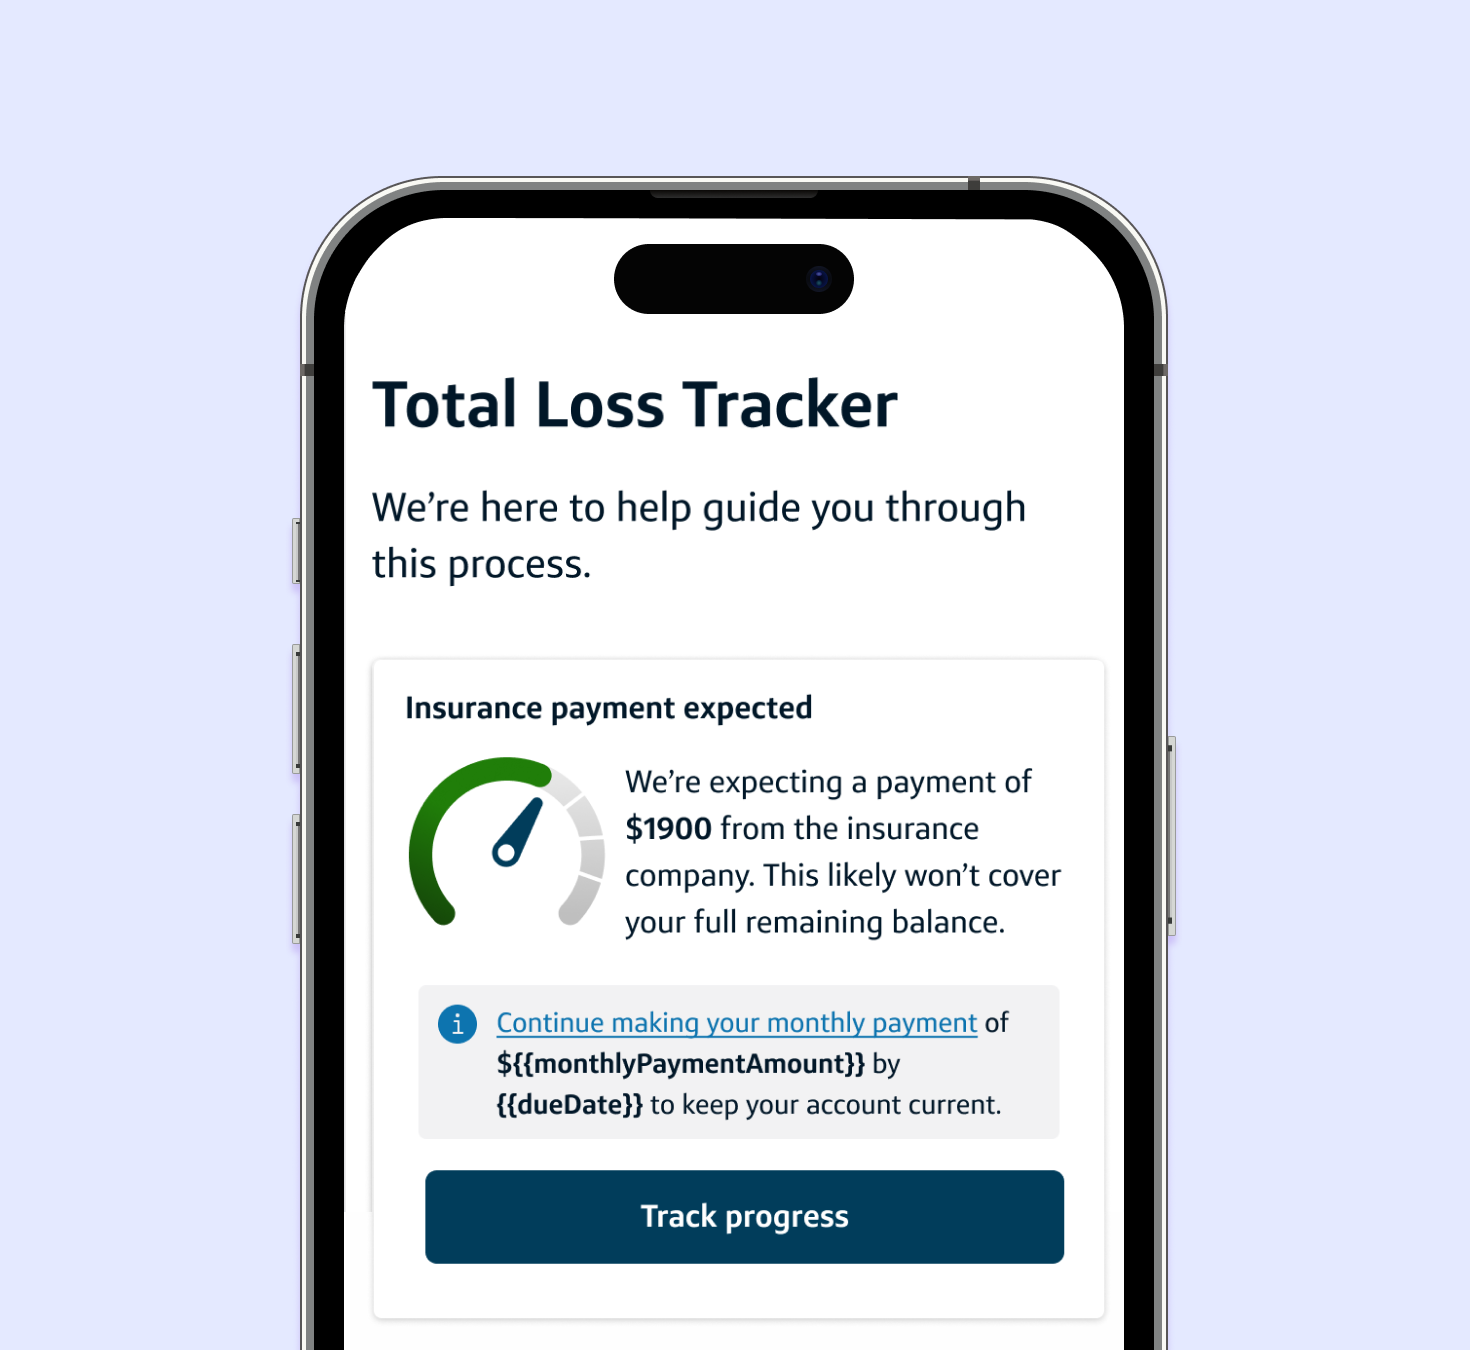
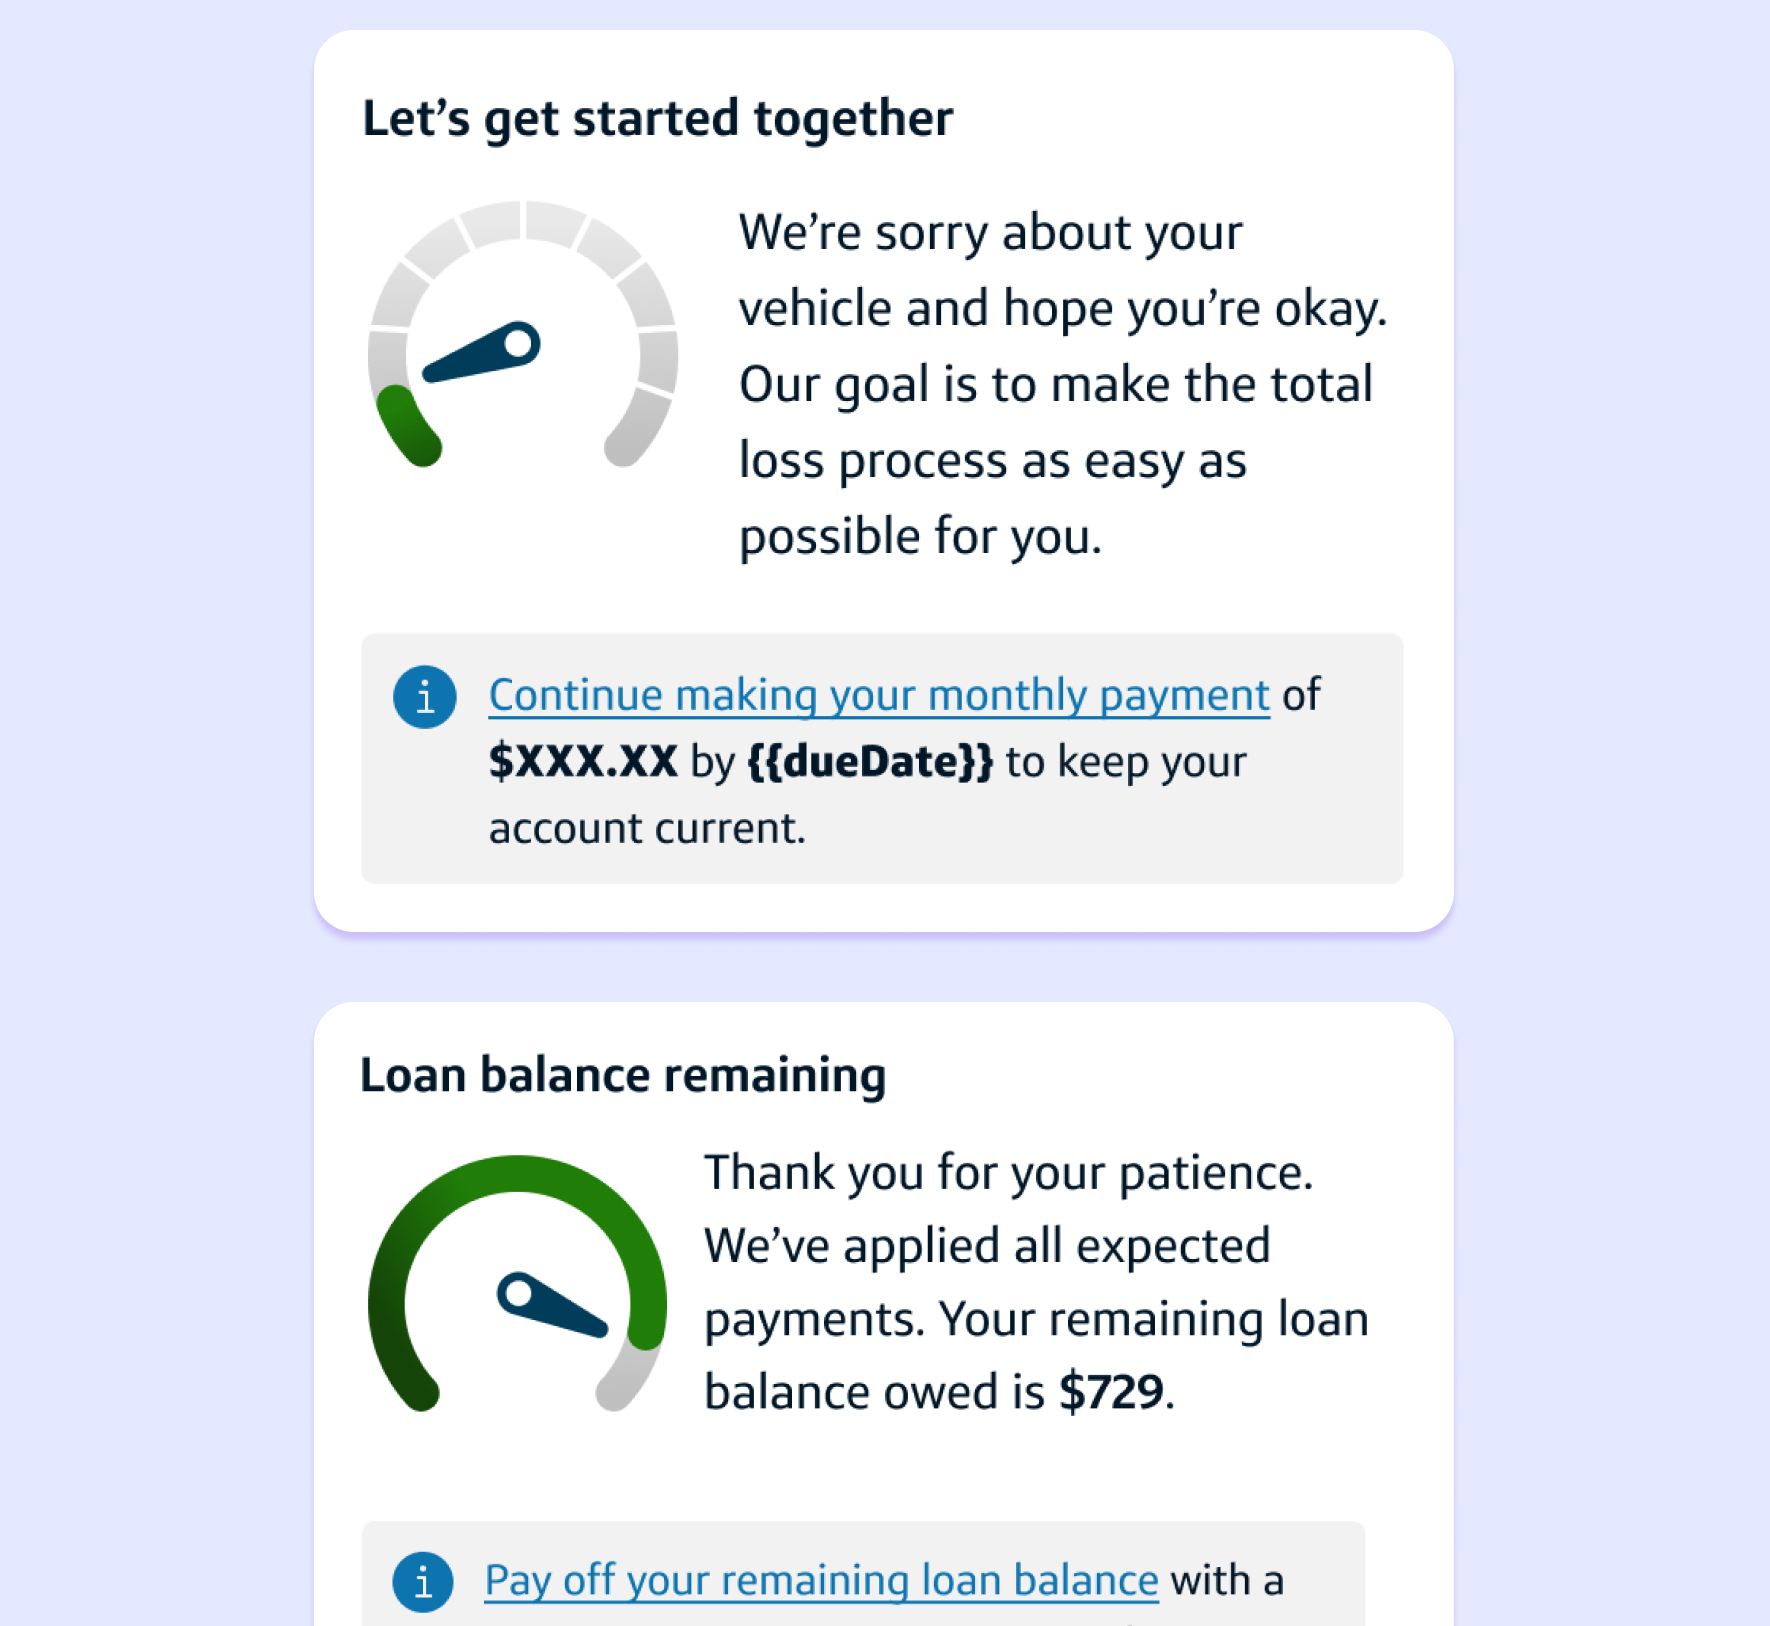
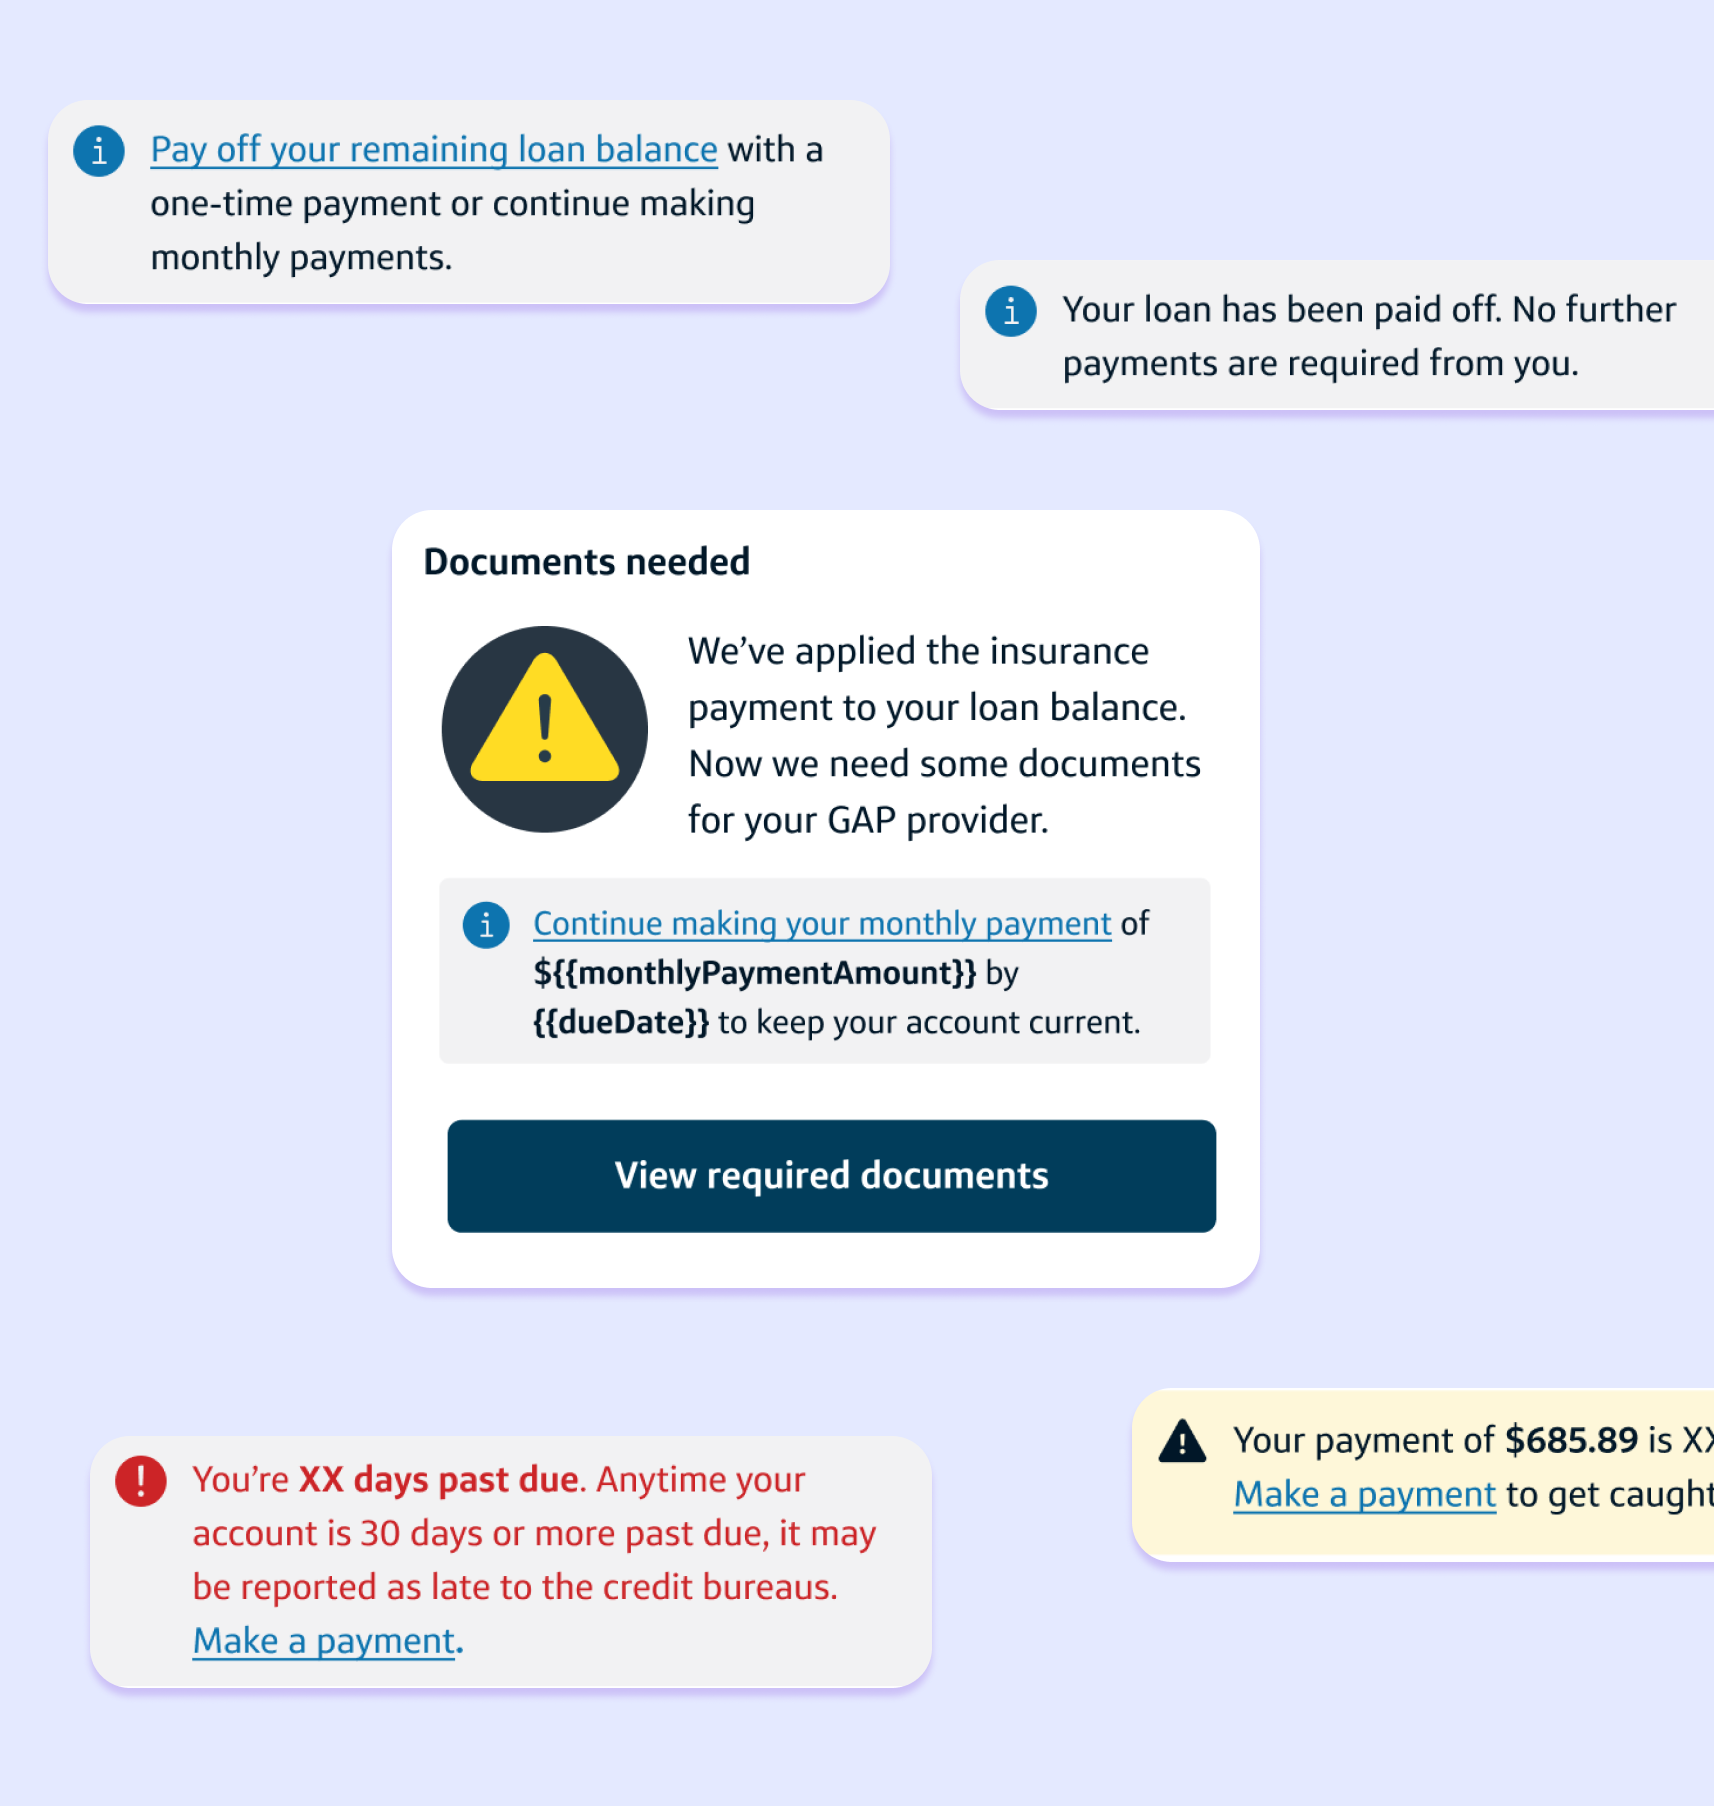
The Total Loss Tracker: A visual, multi-stage progress bar showing the status of insurance payments, warranty cancellations, and GAP claims.
Empathy-First UX: Integrated supportive messaging to acknowledge the stress of the event while providing functional clarity.
Personalized Content: Dynamic UI that updates based on the user's specific scenario (e.g., balance remaining vs. paid in full).
Clear CTAs: Dedicated sections for uploading required documents (Police Reports, Evaluations) and clear instructions on next payment details.
Personalized Content
Clear CTAs
Empathy-First UX
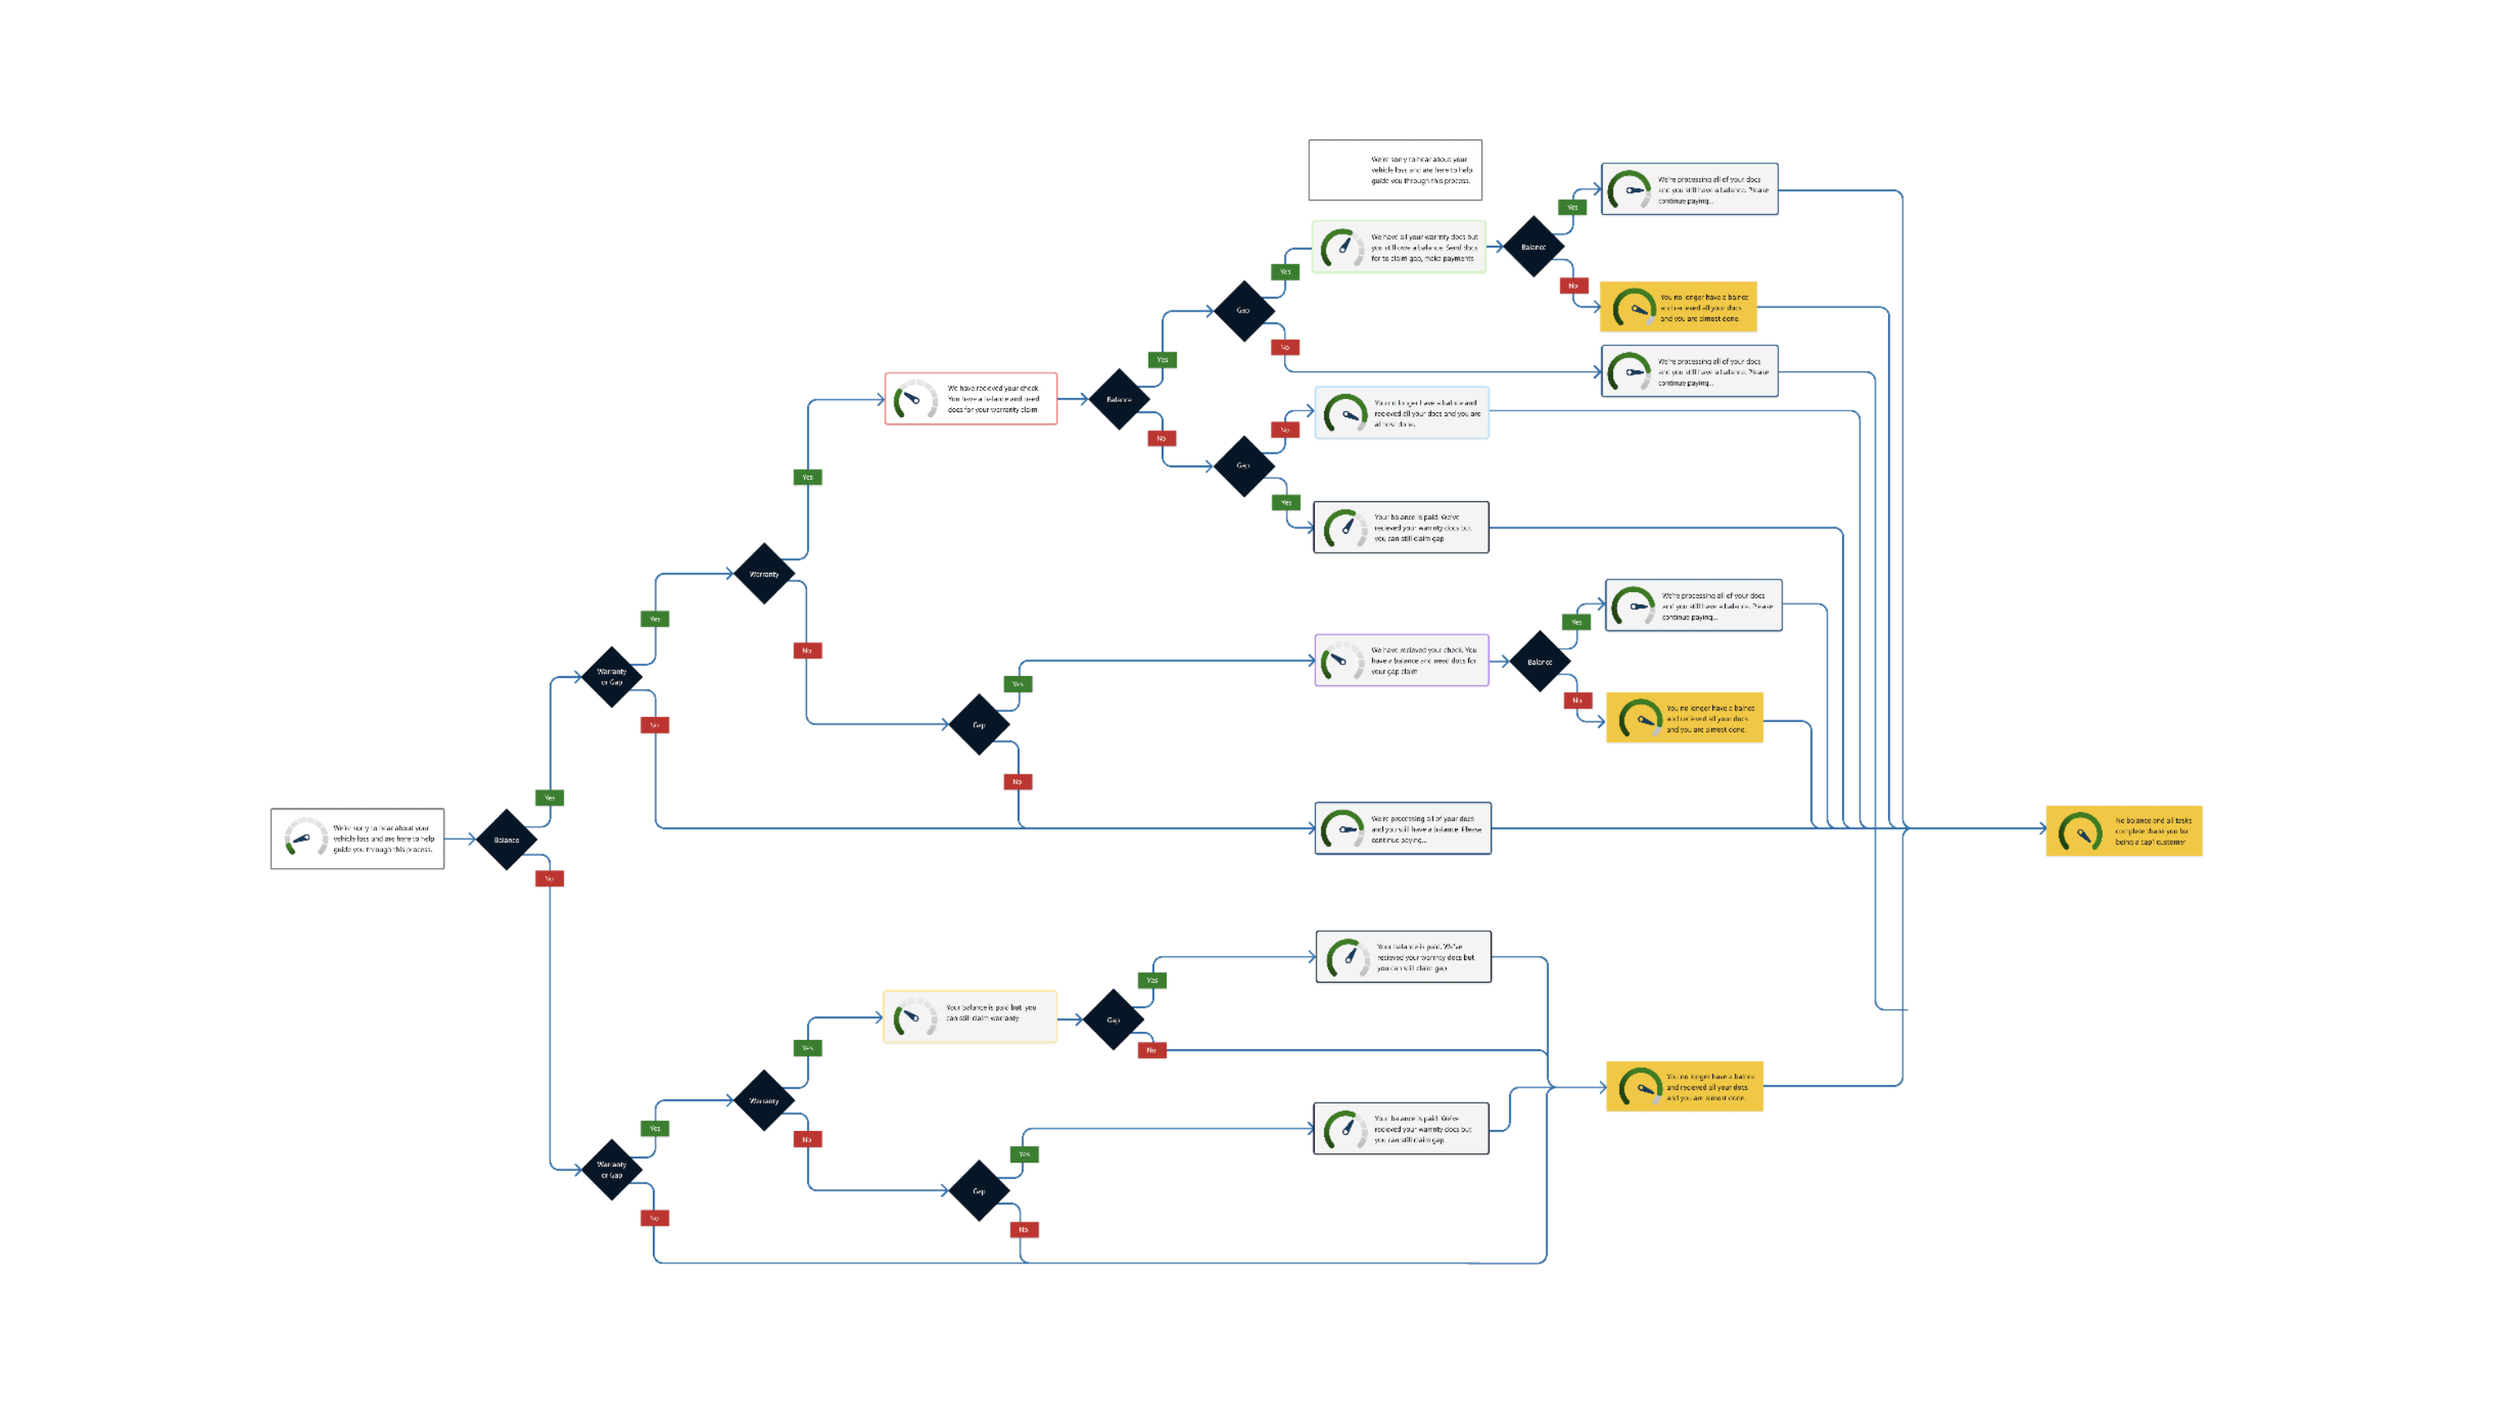
Rules Mapping
The Results
1K Reduction in Calls
Inbound calls reduced from 8k to 7k monthly.
3K Increase in Visits
Monthly visits to the experience grew from 24k to 27k.
15% Increase in Payer Rate
Customers understood their ongoing payment obligations.
Next Steps
Use of Generative AI: Optimize backend processes.
Continued enhancements: Update the customer flow based on ongoing learning and data collection.